Brainstorming Mapping Experience Ideas
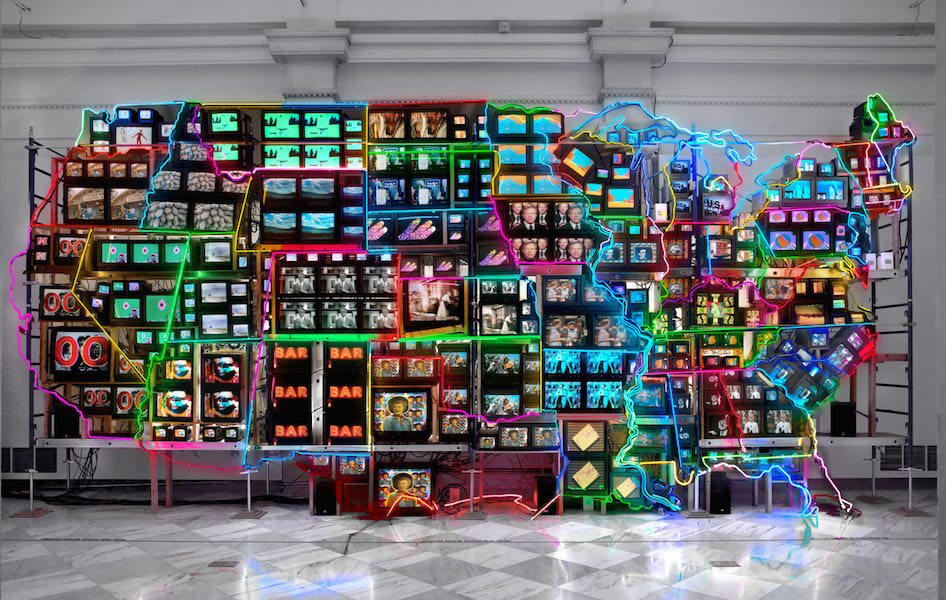
I find the idea of mapping out time to be very interesting. More specifically, mapping out a timeline of major events/news that has happened in 2021. I’ve always found documenting an entire year to be really fascinating (like those popular song mashups for every top song of the year, or when spotify gives you a summary of what music you listened to the most) . Also, I think it could be interesting to have a viewer essentially walk through their entire year, as a sort of reflective and memory experience. One inspiration of mine was Nam June Paik’s Electronic Superhighway, which uses video and tvs to make art and also demonstrates how all the interconnectivity through electronics and the internet can lead to information overload. It could be very interactive and engaging to a user to be able to walk through and click on + watch videos of major news instead of just a static headline or image (perhaps the video could also link to a related article if the viewer is interested in reading more.) Some data sources can be just newspapers, news databases, television databases, etc.