discrete vs continuous
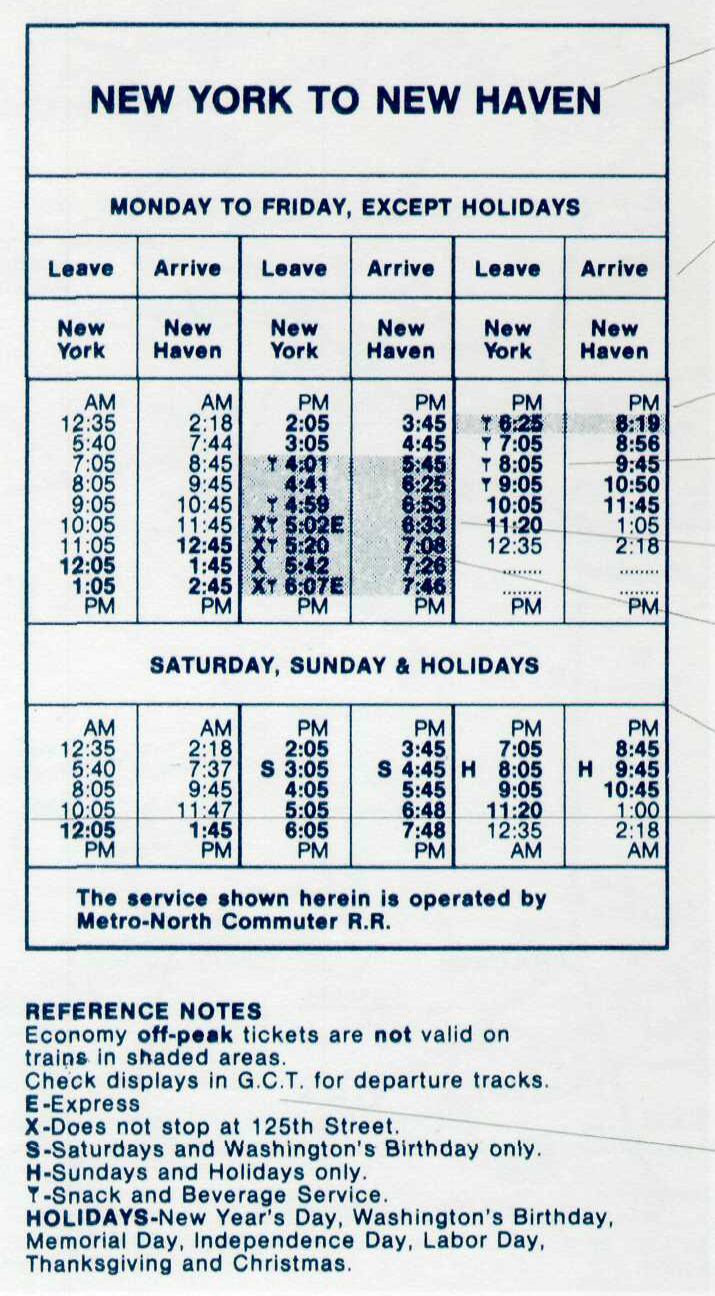
In this reading, Tufte dives futher into exploring the potential of visual design to transmute the narratives of space and time. What I found to be especially interesting is dichotomy between discrete and continuous conceptions of information. He begins the chapter by discussing the findings of Galileo, wherein discrete observations of stars surrounding Jupiter were docuented. However, despite the intelligence of the astronomers of the time, the leap into constructing a continuous narrative of planetary movement was not pioneered until over a century later. This brings into question the element of tension between discrete and continuous data, and how traversing the axis of these two affects the narratives we tell in information. Tufte further explores a series of train schedules. The first, is a table of discrete information only having information on the arrival and departure of a train between New York and New Haven. He discusses the shortcomings of this design, and presents versions which have improved on this framework of displaying discrete times.
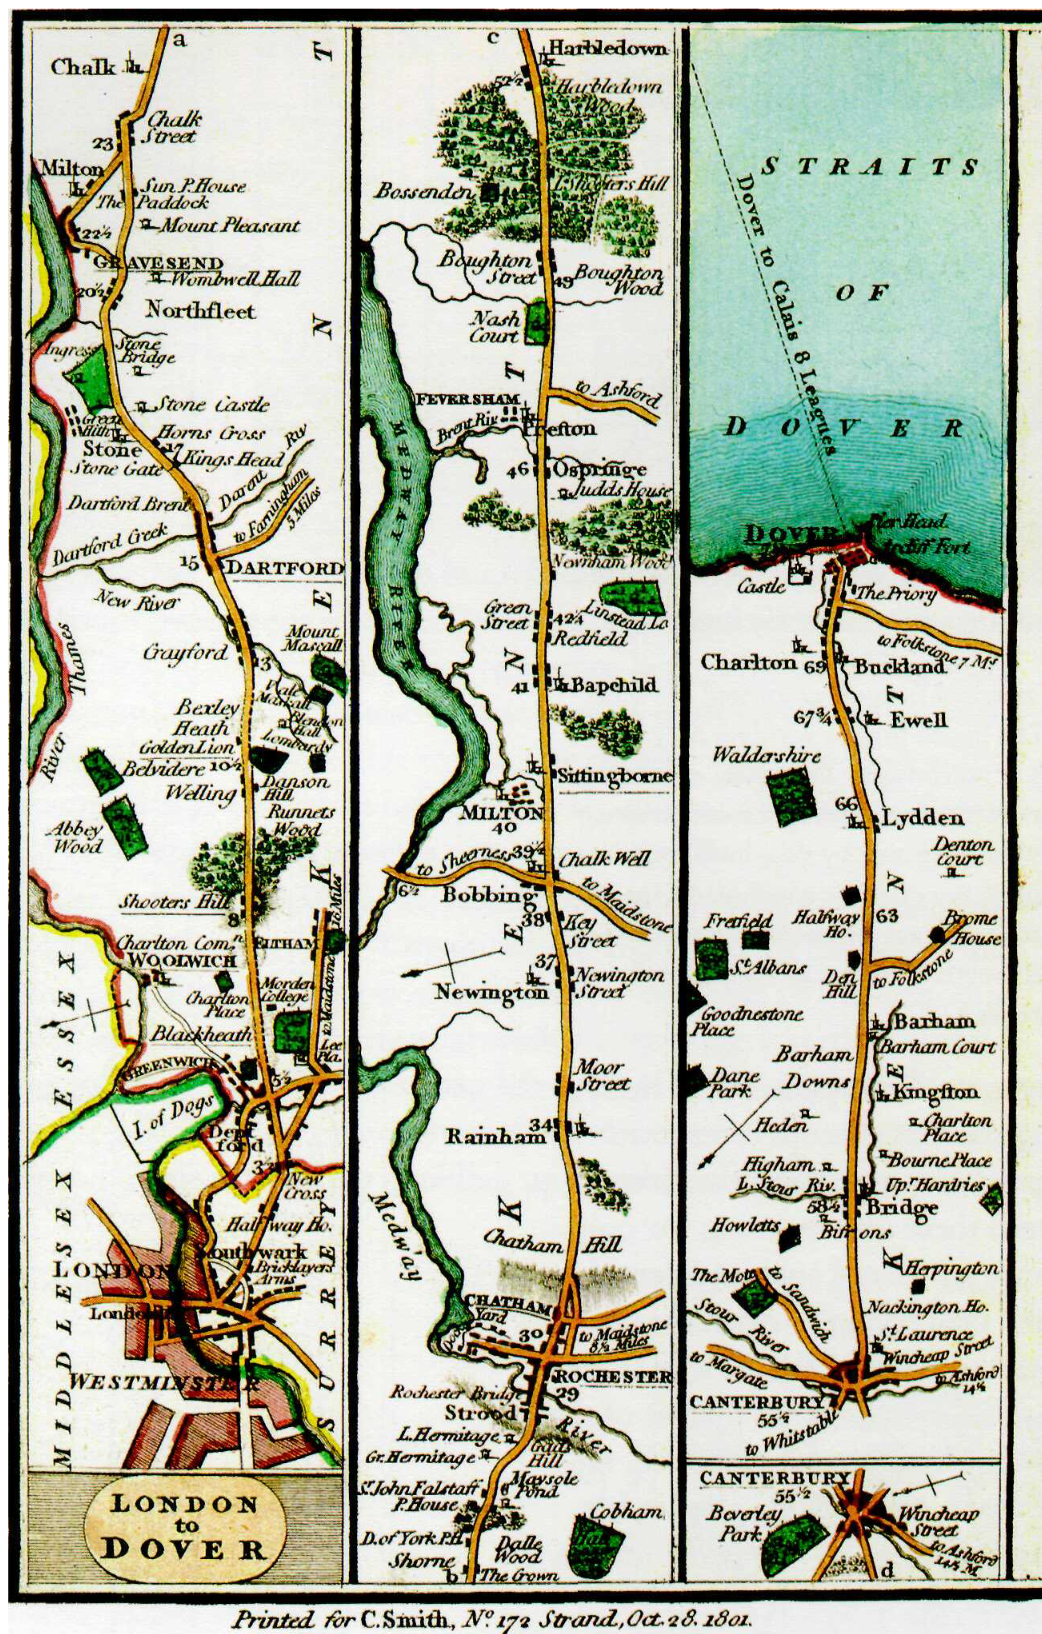
However, a graphical timetable is also presented wherein the train schedule is stretched along the physical geography it traverses, deftly stretching the narrative of train movement into three dimensions.
Questions:
1) In the examples brought up by Tufte (ex. planetary movement, choreography, train timetables), is the use of discrete data or continuous data more effective in “envisioning information” and creating a narrative of space and time?
2) Is having a graphical aspect of design generally helpful for envisioning information? WHen is it not?